There is no single authoritative number for global QR code usage. Published figures vary widely because studies measure different things (people who have ever scanned a code, monthly scanners, payment users, raw scans, installed payment terminals, or software revenue) across different countries and years. This guide collects the figures that trace back to a named source, shows where they disagree, and explains how to read a QR statistic before repeating it.
Treat every number below as one organization's estimate for a stated population and period. Where the original document could not be opened during research, the text says so.
What does a QR code statistic actually measure?
Most confusion comes from mixing quantities that sound alike. A forecast of how many people scan, a count of payment transactions and a revenue estimate for payment software are three separate things, even when all three appear in a headline about "QR code growth".
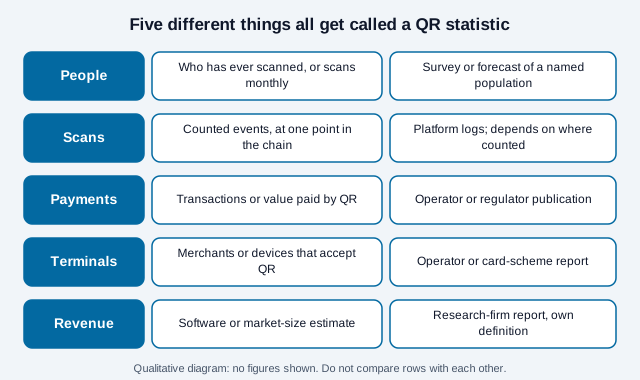
When you meet a number, place it in one of those rows first. Everything else on this page follows from that step.
How many people scan QR codes?
The national estimate most often repeated for the United States traces to a forecast from Insider Intelligence, now part of eMarketer. NFCW reported in July 2022 that the number of US consumers scanning QR codes with smartphones was forecast to rise from 83.4 million in 2022 to 99.5 million by 2025. That article attributes the forecast to Insider Intelligence, while its chart caption names eMarketer, so even the labeling is inconsistent.
A later figure of about 102.6 million US scanners in 2026 appears on several secondary sites. Those sites describe it as an eMarketer forecast made in 2023. The original eMarketer page returned an access error during research, so treat the 2026 number as reported by secondary sources, not as a measured count of 2026 users. It is a projection made years earlier.
Worldwide, no equivalent single figure is maintained. Marketing pages often quote claims such as "80 to 90 percent of people have scanned a QR code". Those usually trace back to small regional surveys or to each other, so this article does not repeat them.
What do consumer surveys add?
QR vendors run their own surveys. Uniqode's "State of QR Codes 2026" report, summarized on its blog (last updated April 2026), says that a survey of 1,000 US consumers found 70% scan a QR code at least once a month, 44% scan weekly or daily and 8% have never scanned. The page does not describe sampling method, fieldwork dates, weighting or question wording, and the vendor sells QR software. These are vendor numbers: useful as a rough signal, not a population measurement.
How large is the QR code market?
Market-size estimates are not comparable across research firms because each defines the market differently. Some count QR generator and management software, others the payment-processing opportunity, others 2D-barcode technology broadly.
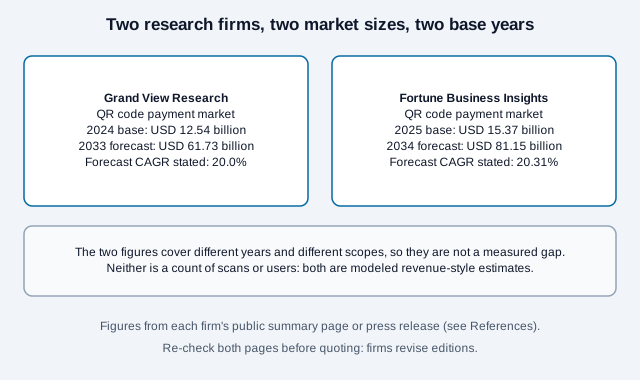
Grand View Research's QR code payment market page lists a 2024 base of USD 12.54 billion and a 2033 projection of USD 61.73 billion, with a 20.0% compound annual growth rate for 2025 to 2033, as summarized in search results and its press release. Fortune Business Insights states USD 15.37 billion for 2025, USD 18.49 billion for 2026 and USD 81.15 billion by 2034, at 20.31%. The Fortune page was readable during research; the Grand View page itself blocked automated access, so its figures come from the search summary and press release.
A 2025 number from one firm and a 2024 number from another are not a disagreement about the same year. If you quote a market size, attach the firm name, base year, currency and market definition.
How much money moves through QR payments?
Juniper Research's press release, dated 10 February 2025, says the global value of QR code payments will grow by 50% from USD 5.4 trillion in 2025, and its headline says they will exceed USD 8 trillion by 2029. The accompanying report covers 61 countries. This measures money transacted, not industry revenue, and it is a forecast made in early 2025.
The clearest data is national, published by the people who run the payment systems. India's Unified Payments Interface (UPI) is reported by the National Payments Corporation of India (NPCI). NPCI's own statistics page blocked automated access, so the figures below come from news coverage of NPCI data:
- August 2026: about 24.51 billion transactions worth about 29.82 lakh crore rupees, a record monthly volume. One outlet put the year-earlier base at 19.63 billion and another at 20.01 billion, so the year-on-year growth rate depends on the base.
- December 2023: 12.02 billion transactions worth 18.23 lakh crore rupees, and 117.6 billion transactions across the whole of 2023.
A large share of UPI merchant payments are QR-initiated, but NPCI's headline totals also include phone-number and account transfers, so "UPI transactions" and "QR scans" are not interchangeable.
How many instant payments start with a QR code? Brazil's Pix data
Brazil is the rare case where a regulator publishes the split. The Banco Central do Brasil's open data for Pix records how each settled transaction was started: static QR code, dynamic QR code, Pix key, manual entry of account details, or a payment initiator. We downloaded that dataset on 30 October 2026 and added up the two QR categories ourselves.
| Month | Pix payments | Share started by QR | QR share of value |
|---|---|---|---|
| Aug 2026 | 7.37 billion | 52.0% | 11.6% |
| Sep 2026 | 7.17 billion | 52.1% | 11.3% |
So in Brazil about half of all instant payments by count now begin with a QR scan, but those payments carry only about a ninth of the money. Large transfers mostly go through a Pix key or typed account details. Dynamic codes, generated per sale by a checkout or app, outnumber printed static codes by more than five to one: 3.23 billion against 0.60 billion in August, and 3.14 billion against 0.59 billion in September. Two limits apply: this is one country with a state-run scheme, and the August total matches the 7.37 billion reported in Brazilian press coverage, but the dataset can be revised. Our calculation is easy to repeat from the central bank's public endpoint listed in the references.
China's Alipay and WeChat Pay are the other major sources of QR payment volume, and this review found no open transaction breakdown from either that could be cited. For how businesses take these payments, see the guide to accepting QR code payments.
Where is a scan counted, and why does it matter?
Even a first-party "number of scans" depends on where the count happens. A phone camera decodes a code without telling anyone. A redirect server can log a hit, including bots and link-preview fetches. A landing page's analytics only sees people whose browsers load the page and run the script.
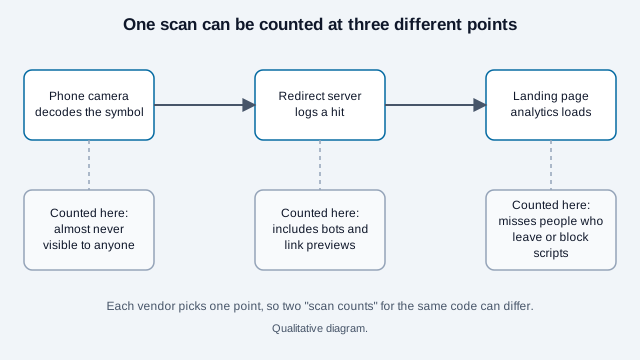
Static codes carry the destination directly, so scans of a static code can only be measured from the landing page, usually with campaign tags. Dynamic codes route through a redirect, which is why they report scan counts. The static versus dynamic guide covers the trade-off.
What do the QR phishing (quishing) numbers say?
None of the sources used here gives a trustworthy figure for how common QR phishing is across all email. Security vendors do publish rates, but each describes the traffic that vendor's own customers received, a much narrower population. Before repeating a percentage, record the report, observation dates, customer sample, and whether the denominator is all emails, malicious emails or phishing emails.
The FTC's consumer guidance documents the attack pattern without supplying a global prevalence estimate. Use the quishing guide for prevention advice.
Why do published QR statistics disagree so much?
| Difference | Why it changes the number |
|---|---|
| What is counted | People, scans, sessions, payment transactions, terminals and software revenue are separate quantities. |
| Which population | "US adults", "global smartphone owners" and "one vendor's customers" give very different denominators. |
| Which period | "Ever scanned" is always larger than "scanned this month". Pandemic-era spikes distort year-on-year comparisons. |
| Forecast or measurement | A 2023 forecast of 2026 users is a model output. A monthly operator report is a count. |
| Who is measuring | A central bank, a standards body and a vendor with a product to sell have different incentives and methods. |
Checklist: how should you use a QR statistic?
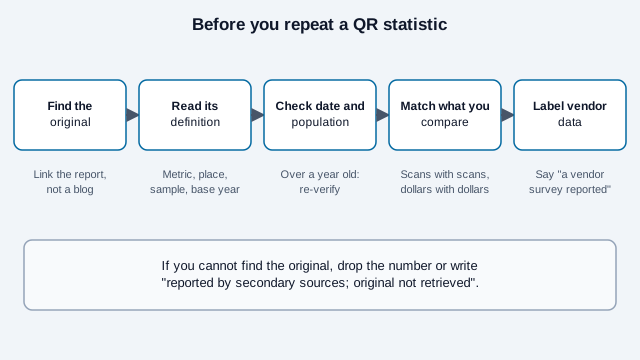
- Follow a cited figure back to the research firm, regulator or survey that produced it, not the blog that repeated it.
- Note the metric, geography, sample size, base year and currency next to the number.
- Compare only figures that measure the same thing over the same population.
- Prefer a primary operator's published volume over a secondary market aggregation.
- Re-check the date. A figure more than a year old should be re-verified before publication.
What goes wrong when people quote these numbers?
Imagine a small-business blogger writing "100 million Americans scan QR codes, and the market is worth USD 15 billion, so you need one." The first figure is a user forecast from 2022 and the second is a payment-software estimate. Neither says anything about whether the blogger's customers will scan a code on a flyer. The sentence also lumps a 2025 projection together with a 2026 one without saying so.
A safer version names the sources: "A 2022 Insider Intelligence forecast, reported by NFCW, expected about 99.5 million US smartphone QR scanners by 2025." It is longer, and a reader can check it.
What should you measure for your own campaigns?
The useful measurement is first-party. Tag destination URLs and read visits and conversions in your analytics, as described in the QR code tracking guide. Build a campaign link with the UTM builder, then generate and test its QR code before printing. Public statistics can justify trying QR codes. Your own scan-to-visit ratio decides whether to keep them.
What this page cannot settle
Open questions remain that this page cannot settle: no open global scan count exists, the 2026 US forecast could not be traced to its original page, and the Grand View and NPCI pages could not be opened directly. Re-verify any figure before you publish it.
Figures cited here reflect the sources named and the dates given. They are informational, not investment or business advice.
References
- NFCW: Nearly 100m US consumers will be scanning QR codes by 2025 (26 July 2022)
- eMarketer: QR code user forecasts (page blocked automated access)
- Uniqode: QR code statistics (vendor survey)
- Juniper Research: QR code payments to exceed $8tn by 2029
- Grand View Research: QR code payment market press release
- Fortune Business Insights: QR code payment market
- NPCI: UPI product statistics (page blocked automated access)
- DT Next: UPI transactions in August 2026
- Business Standard: UPI December 2023 and full-year 2023
- FTC: Scammers hide harmful links in QR codes
- Banco Central do Brasil: Estatísticas do Pix
- Banco Central do Brasil: Pix open data documentation (EstatisticasTransacoesPix, initiation codes QRES and QRDN), data downloaded 30 October 2026